 Store Leads
The State of Ecommerce in 2026
Ecommerce platform usage has exploded over recent years as the world's economy transitions to online. Our mission is to observe and inform on ecommerce usage trends so that app developers and marketers can help merchants succeed. To that end, we are tracking 13,659,968 live stores running on 100 different ecommerce platforms.
Platform Distribution
Here is a summary of the current state of the ecommerce platforms wars:
- By merchant count, WooCommerce and Shopify dominate. Shopify is growing slightly faster, appears to have greater mindshare and has larger merchants on average.
- Magento and PrestaShop are quite close, in terms of merchant count, but the average Magento merchant is much larger.
- Square Online is the ecommerce platform with the highest percentage growth, though it mostly powers micro-merchants.
- Salesforce Commerce Cloud powers relatively few stores but their stores are some of the biggest merchants around (Patagonia, PUMA, etc.)
Top Stores
Here are the top 0 ecommerce stores, across the platforms we track, ordered by worldwide store rank.
New Stores
Here are the 0 highest-ranked stores added most recently.
Category Breakdown
Here are the top 20 industry verticals for stores on the platforms we track.
Country Breakdown
Across the platforms we track, the largest install base is within the United States. But the platforms have a solid presence within the United Kingdom, Canada and Australia as well.
Social Media and Contact Info
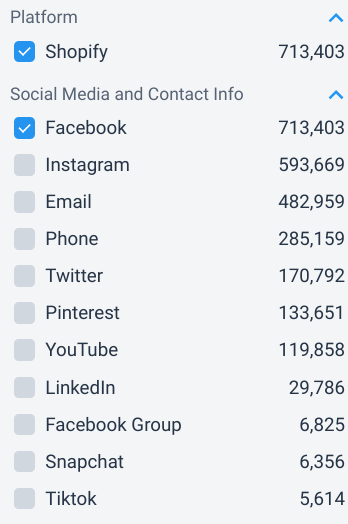
Facebook, Twitter, Instagram and Pinterest have significant presence across stores, with Facebook and Instagram especially showing quite strongly.
As expected, email remains an extremely popular communication channel.
Third-Party Technologies
Many merchants run third-party technologies on their store in addition to apps from their ecommerce platform's App Store. We're tracking 965 different technologies that have 71,281,482 collective installs.
Here are the top 10 third-party technologies, ordered by number of installs, across all stores.
Shipping Carriers
Here are the top 10 shipping carriers, ordered by frequency of use, across all stores.
Top-level Domain Distribution
.com is the most popular top-level domain for ecommerce stores. This is not surprising since alternate top-level domains have only recently been introduced and there is still a certain cachet associated with .com domains.
Get more insights on stores
Our search interface is easy to use and helps you find the stores that are relevant to you.
You can segment stores on a variety of dimensions:
- Social Media accounts
- Email address
- Phone numbers
- Country
- Installed Apps
- Creation date
- Platform
- Top-level domains
- Domain status
- Domain type
For more insights on stores, create a free account and have a look for yourself.